Alertmanager⚓︎
This page provides an overview of Alertmanager and its use in Prokube, without delving into details.
Official Definition: The Alertmanager handles alerts sent by client applications such as the Prometheus server. It takes care of deduplicating, grouping, and routing them to the correct receiver integration such as email, PagerDuty, or OpsGenie. It also takes care of silencing and inhibition of alerts.
Since Alertmanager is part of the Prometheus project, it might appear that it is designed to work exclusively with Prometheus and currently, Prokube uses Alertmanager solely for Prometheus alerts. However, Alertmanager can be integrated with any client application that supports Alertmanager integration. Grafana is one such application that implements Alertmanager integration.
As mentioned above, Alertmanager is an application for managing alerts. It is not used for creating alerts, but to notify when an alert happens. Therefore, if you want to create an alert, for example when you are running out of storage, you first need a client application that is actually generating the alert itself. Prometheus is one of those client applications and it creates these alerts through alerting rules.
Prokube deploys Alertmanager using kube-prometheus-stack helm chart, which uses prometheus-operator to deploy Prometheus and Alertmanager. Prometheus-operator, together with the applications, provides additional CRDs to make it easier to configure Prometheus and Alertmanager. Thanks to these CRs, we don't have to write one, complete configuration for Prometheus and Alertmanager and we add CRs when needed to extend the configurations. For this document, the important CRDs are PrometheusRule and AlertmanagerConfig .
PrometheusRule⚓︎
Official Definition: The PrometheusRule custom resource definition (CRD) defines alerting and recording rules to be evaluated by Prometheus or ThanosRuler objects.
Prometheus and ThanosRuler objects select PrometheusRule objects using label and namespace selectors.
You can see the active PrometheusRules in Prokube with kubectl:
kubectl get prometheusrules -A
For more information about PrometheusRule and how to write Prometheus rules, please check the given references for PrometheusRule and Prometheus alerting rules.
AlertmanagerConfig⚓︎
Official Definition: The AlertmanagerConfig custom resource definition (CRD) defines how Alertmanager objects process Prometheus alerts. It allows to specify alert grouping and routing, notification receivers and inhibition rules.
Alertmanager objects select AlertmanagerConfig objects using label and namespace selectors.
At the time of writing, Prokube does not have a generic AlertmanagerConfig. Instead, configurations are created case-by-case. For more information about how to write Alertmanager configuration and AlertmanagerConfig CR, please check the given references.
At a basic level, you require:
- a
receiver, which is the notification channel that will receive the alerts such as a Microsoft Teams message, Slack message etc. - a
route, which is the alerting rules that will match the alerts to the receivers.
An example of a simple configuration that catches all critical alerts and sends them to a Microsoft Teams channel would look like this:
apiVersion: monitoring.coreos.com/v1alpha1
kind: AlertmanagerConfig
metadata:
  name: all-critical-alerts
  namespace: monitoring
spec:
  receivers:
  - msteamsv2Configs:
    - sendResolved: true
      # A descriptive title would be helpful to identify the source of the alert
      # msteamsv2 comes with default title with information about the alert
      title: '[Prokube Cluster] {{ template "msteamsv2.default.title" . }}'
      webhookURL:
        key: webhook-url
        name: msteams-webhook-secret
    name: msteamsv2-receiver
  route:
    matchers:
    # Match all alerts with severity=critical
    - matchType: =
      name: severity
      value: critical
    receiver: msteamsv2-receiver
To shortly explain this example, we can see a receiver and the route:
- In receivers, we can see a msteamsv2Config, which has:
- webhookURL: It comes from a secret (see the next section on how to) and it is used to send the alert to a teams webhook endpoint in an adaptive card formatted way (hence the v2 config)
- sendResolved: Tells alertmanager to send notification when an alert is resolved
- title: The title of the notification that will be seen in Teams.
- In route, we can see one simple matcher:
- matchType: "=" matches the exact match. Matcher for further information
- name: Label to match. In this case, we are checking
severitylabel in the alert. - value: Label value to match. In this case, we are matching
criticalseverity alerts to send notifications. The label name and the value are provided by the client application that is generating the alert. In this case, that would be Prometheus, which is generating it through a PrometheusRule. Therefore, to be able to create alert notifications, one must know what kind of alerts will be received by the Alertmanager.
For this config to function successfully, you will require a secret configuring Webhook URL. See the next section for the Microsoft Teams example.
Please check the AlertmanagerConfig reference for further information on how to write a configuration.
Sending a notification to Microsoft Teams⚓︎
At the time of writing, Microsoft Teams is using "Workflows" for automation to posting to channels. The given reference below explains in further detail. When a workflow is created, it provides a webhook url that can be used in Alertmanager.
Warning
Microsoft is deprecating the creation and usage of Microsoft 365 connectors via Microsoft Teams. Therefore, older msteams config is not working properly in Alertmanager anymore. Therefore, make sure you are using Workflows with the msteamsv2 config.
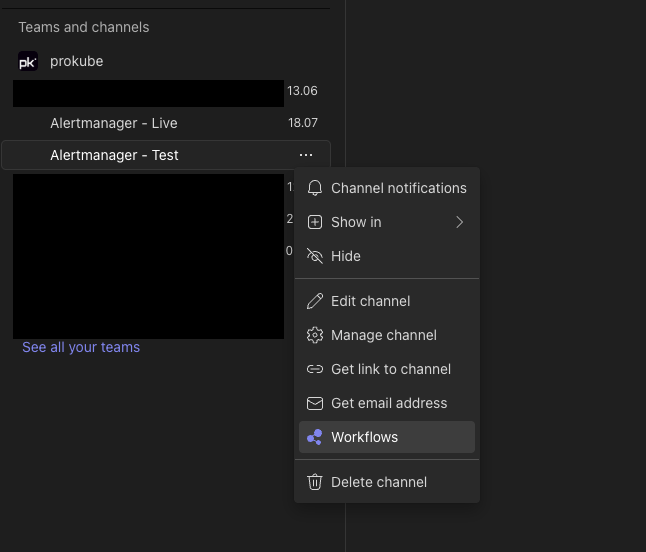
To setup Teams, create a channel to receive alerts or use an existing channel. Click on the menu of the channel and go to Workflows.
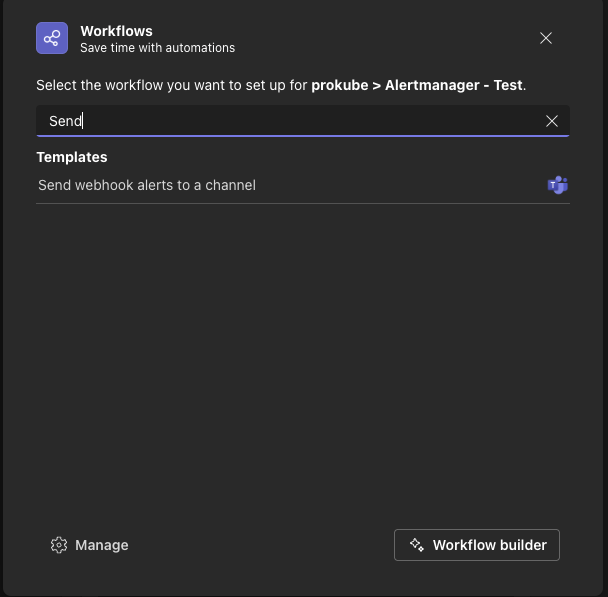
Choose "Send webhook alerts to a channel"
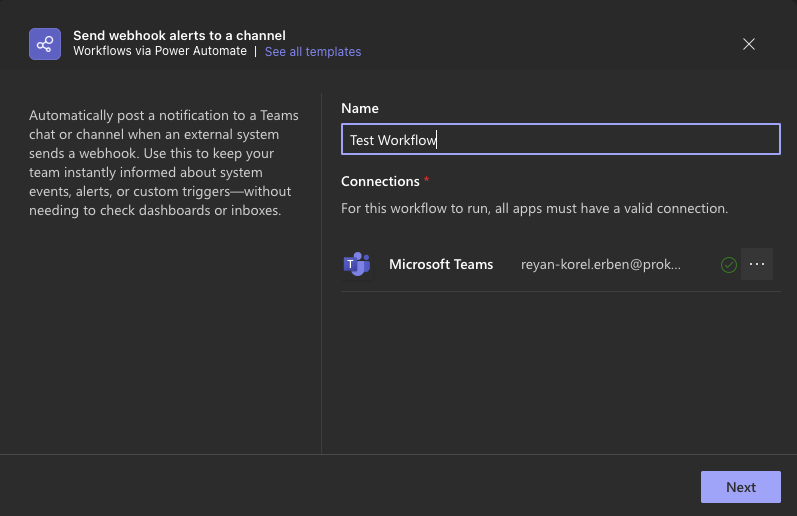
Give it a name and choose a connection. It is recommended to create a service account for this to avoid using personal accounts. Example below uses a personal account:
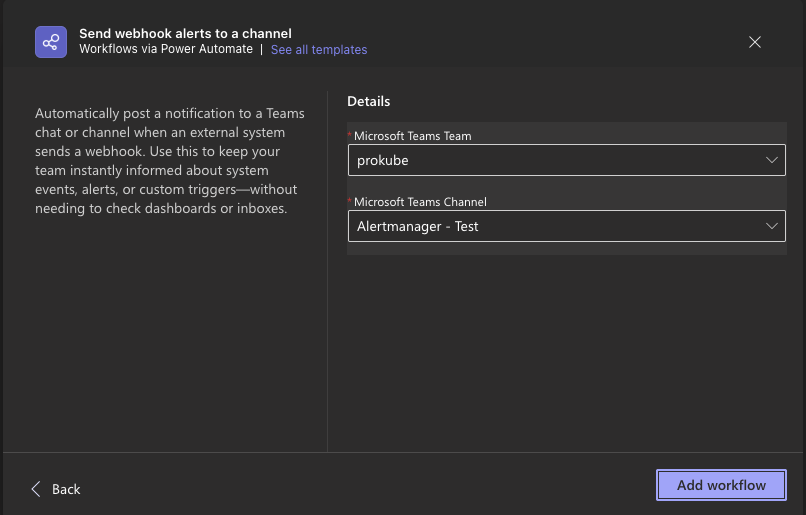
Add the workflow:
After adding the workflow, Teams will directly show you the workflow webhook URL
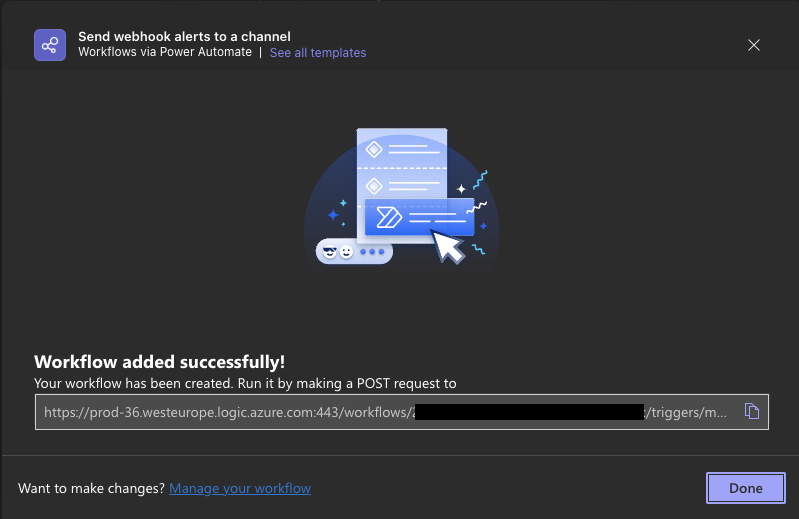
This is the URL that is used in Alertmanager msteamsv2 config! To create a corresponding secret in your cluster, run:
kubectl create secret generic msteams-webhook-secret --from-literal=webhook-url=<YOUR_WEBHOOK_URL>
Created workflow can be opened at: "Workflows (from left menu) -> Choose the Workflow under "Your Workflows" → "Edit in Power Automate". The webhook URL can be found under "When a Teams webhook request is received" card. Additionally, workflow can also be configured in Power Automate portal.
Recipes⚓︎
Crashloop Alert⚓︎
Deploy this PrometheusRule to get alerts about namespaced pods that are in "CrashLoopBackOff" state for over 3 minutes (adjust APP_NAMESPACE in the manifest below):
apiVersion: monitoring.coreos.com/v1
kind: PrometheusRule
metadata:
  labels:
    role: alert-rules
  name: app-crashloop-prometheus-rules
  namespace: monitoring
spec:
  groups:
  - name: app-crashloop
    rules:
    - alert: PodCrashLooping
      annotations:
        description: >
          Pod {{ $labels.namespace }}/{{ $labels.pod }} ({{ $labels.container }})
          is in waiting state (reason: "CrashLoopBackOff") on cluster
          {{ $labels.cluster }} for over 3 minutes.
        summary: Pod in {{ $labels.namespace }} namespace is crash looping.
      expr: >
        max_over_time(
          kube_pod_container_status_waiting_reason{
            job="kube-state-metrics",
            namespace="<APP_NAMESPACE>",
            reason="CrashLoopBackOff"
          }[3m]
        ) >= 1
      for: 3m
      labels:
        severity: critical
KServe Model Down Alert⚓︎
The following alert fires if all revisions for some KServe InferenceService in any namespace are down:
apiVersion: monitoring.coreos.com/v1
kind: PrometheusRule
metadata:
  name: knative-service-revision-alerts
  namespace: monitoring
  labels:
    role: alert-rules
spec:
  groups:
  - name: knative-revision-alerts
    rules:
    - alert: KnativeServiceCompletelyDown
      annotations:
        description: >
          All revisions of Knative service {{ $labels.name }} in namespace
          {{ $labels.namespace }} are not ready. This means the service cannot
          serve traffic.
        summary: Knative service {{ $labels.name }} is completely down.
      expr: |
        (
          kube_customresource_knative_revision{type="Ready"} == 0
        )
        unless on(namespace)
        (
          max by (namespace, service_name) (
            label_replace(
              kube_customresource_knative_revision{type="Ready"},
              "service_name",
              "$1",
              "name",
              "^(.*)-[0-9]+$"
            )
          ) > 0
        )
      for: 2m
      labels:
        severity: critical