Autoscaling⚓︎
KServe supports 3 types of autoscaling: with Knative Pod Autoscaler (KPA), with Kubernetes HPA and with KEDA.
Knative Pod Autoscaler (KPA)⚓︎
This section covers Knative-based autoscaling, which is the default for KServe.
The huggingface examples below are largely based on the upstream documentation.
A prerequisite to run test examples below is the hey tool for load testing (used to generate traffic). You need to install it to the machine where you will make the API calls to the models. For example, to install it on a MacBook, run:
brew install hey
Example⚓︎
Autoscaling works for models running both on CPU and on GPU. The example below is CPU-only, but can be easily adjusted for using GPU-based model.
To create an example workload, deploy a KServe InferenceService custom resource. KServe will take care of creating everything else for you, including the Pod and the route.
One way to enable autoscaling is to add scaleTarget and scaleMetric keys to the InferenceService predictor spec. The example below uses scaleMetric: concurrency to determine the need for autoscaling, and scaleTarget: 1, indicating (in combination with this metric) soft limit for the number of concurrent requests per replica. If there is a sudden burst of requests, this value can be exceeded. A strict per-replica concurrency cap, if desired, is set separately via containerConcurrency (see later examples).
The following code snippet deploys an example for testing autoscaling. It can be run from your local terminal or from a kubeflow notebook terminal. You need a kubeconfig for connecting to your cluster, to run the kubectl command. Also change the NAMESPACE below to your namespace, if you want the workload to be deployed there.
export METRIC="concurrency"         # alternative: qps
export NAMESPACE="default"          # change to your desired namespace
export ISVC_NAME="distilbert-cpu"
export MODEL_NAME="distilbert"

kubectl apply -n ${NAMESPACE} -f - <<EOF
apiVersion: serving.kserve.io/v1beta1
kind: InferenceService
metadata:
  name: ${ISVC_NAME}
spec:
  predictor:
    scaleTarget: 1
    scaleMetric: ${METRIC}
    model:
      modelFormat:
        name: huggingface
      args:
        - --model_name=${MODEL_NAME}
        - --model_id=distilbert-base-uncased-finetuned-sst-2-english
      resources:
        limits:
          cpu: "4"
          memory: 8Gi
        requests:
          cpu: "2"
          memory: 4Gi
EOF
Get InferenceService's status and wait for READY to be True (you can also track all of that in the Kubeflow UI -> Endpoints):
kubectl get isvc $ISVC_NAME -n $NAMESPACE
Sample output:
NAME             URL                                               READY   PREV   LATEST   PREVROLLEDOUTREVISION   LATESTREADYREVISION              AGE
distilbert-cpu   https://<DOMAIN>/serving/default/distilbert-cpu   True           100                              distilbert-cpu-predictor-00002   2m
When the model is ready, get the endpoint URL (requires jq, otherwise just copypaste from previous command's output):
export MODEL_URL=$(kubectl get isvc $ISVC_NAME -n $NAMESPACE -o json | jq -r ".status.url")
Run concurrent requests with hey (you can obtain the API key from your admin, if you don't have one):
  export X_API_KEY="<your key>"

# 5 concurrent runners
hey -z 30s -c 5 \
  -m POST \
  -H "Content-Type: application/json" \
  -H "x-api-key: ${X_API_KEY}" \
  -d '{"instances":["MLOps is wonderful!"]}' \
  ${MODEL_URL}/v1/models/${MODEL_NAME}:predict
Check the number of running pods now:
kubectl get po -n $NAMESPACE | grep $ISVC_NAME
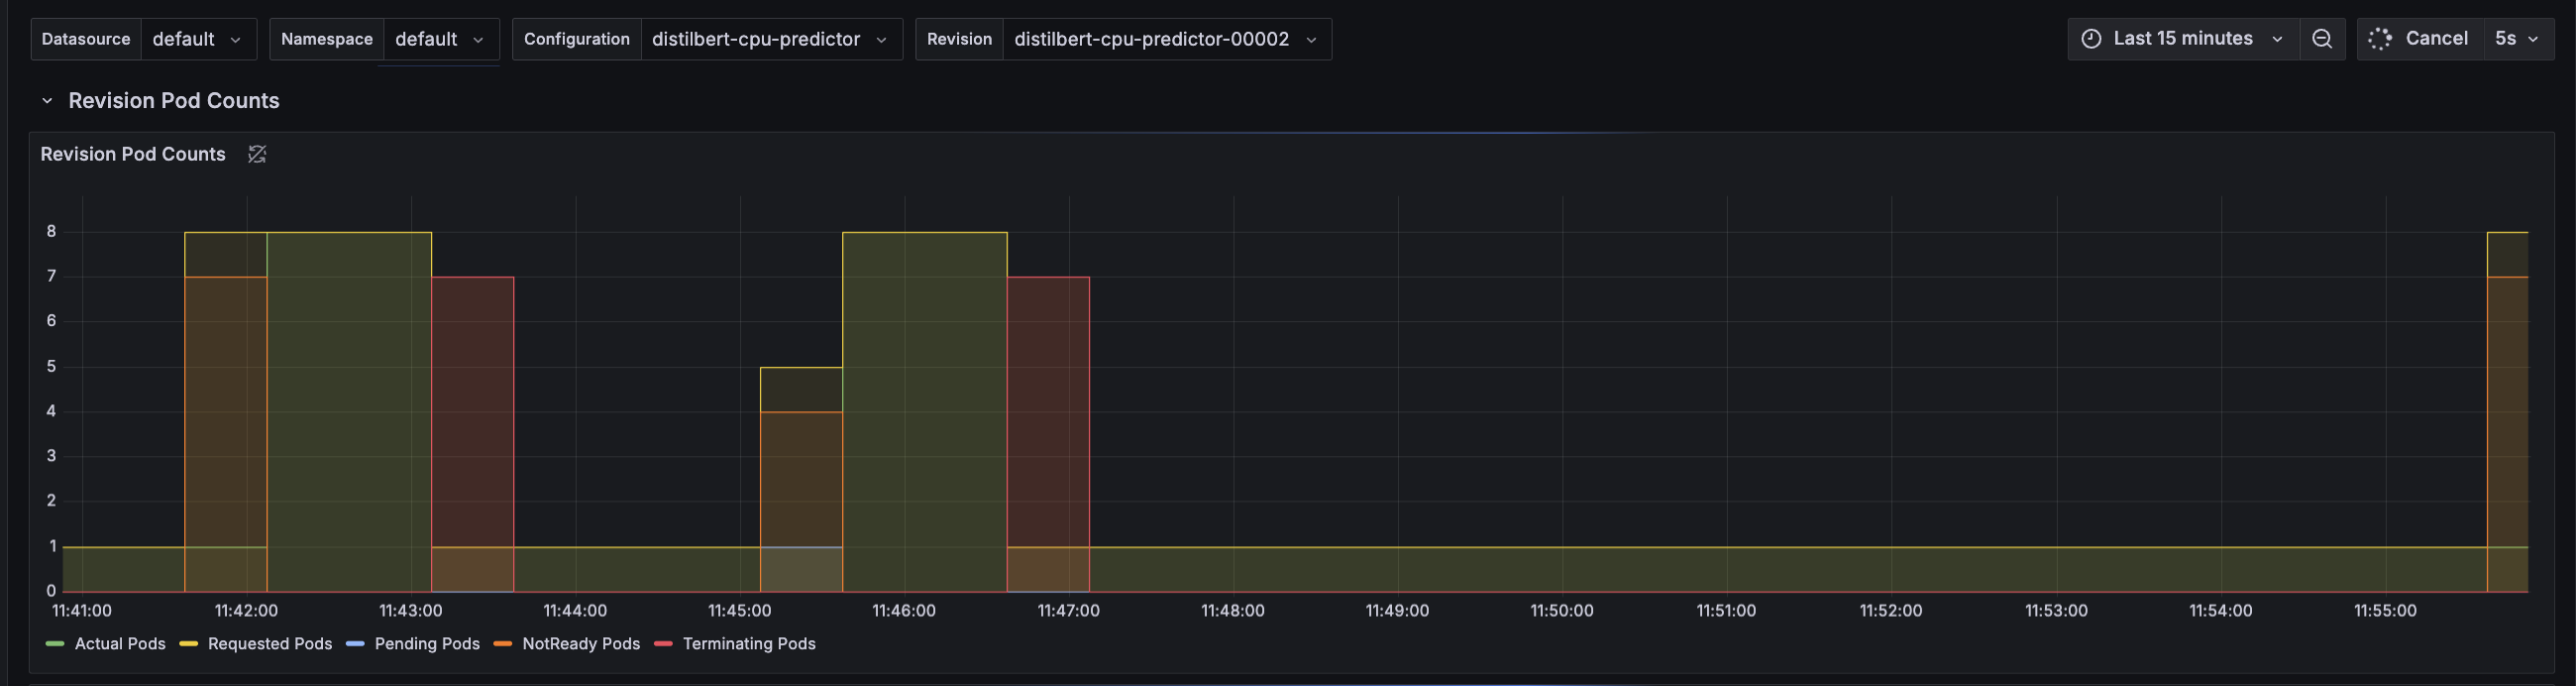
KServe uses the Knative autoscaler which is based on the average number of in-flight requests per pod (concurrency). As the scaling target is set to 1, and we load the service with 5 concurrent requests, the autoscaler tries scaling up to 5 pods. In practice, more than 5 pods can be created: if the cold-start time is long, incoming requests accumulate while no pods are ready, which triggers Knative's aggressive (panic) scale-up behavior. Take a look at hey output:
Response time histogram:
  0.422 [1]     |■■
  2.163 [23]    |■■■■■■■■■■■■■■■■■■■■■■■■■■■■■■■■■■■■■■■■
  3.905 [5]     |■■■■■■■■■
  5.647 [2]     |■■■
  7.389 [2]     |■■■
  9.131 [2]     |■■■
  10.872 [1]    |■■
  12.614 [1]    |■■
  14.356 [1]    |■■
  16.098 [0]    |
  17.839 [4]    |■■■■■■■
You notice that there are 4 requests on this histogram that take around 18s - that's the cold start time cost to initially spawn the pods and download the model to be ready to serve. The cold start may take longer (to pull the serving image) if the image is not cached on the node that the pod is scheduled on.
You can also check out Knative Serving - Scaling Debugging dashboard in Grafana for additional visual details.
Alternatively, you can set export METRIC=qps in the example in the beginning of this section, to enable scaling based on the number of queries per second (QPS). In this mode, the autoscaler calculates average concurrency over a 60-second window, so it takes a minute to stabilize at the desired concurrency level. However, it also calculates a 6-second panic window and will enter into panic mode if that window reaches 2x target concurrency.
An example hey command for this case:
  export X_API_KEY="<your key>"

# run 5 queries per second: build a queue
hey -z 30s -q 5 \
  -m POST \
  -H "Content-Type: application/json" \
  -H "x-api-key: ${X_API_KEY}" \
  -d '{"instances":["MLOps is wonderful!"]}' \
  ${MODEL_URL}/v1/models/${MODEL_NAME}:predict
Further metrics are available in Knative docs.
Customization and Knobs⚓︎
There are several ways to influence autoscaling, available through InferenceService spec:
spec:
  predictor:                  # or transformer
    scaleTarget: 1            # value of scaleMetric, exceeding which causes upscaling
    scaleMetric: qps          # alternatives: concurrency, memory, cpu
    containerConcurrency: 10  # hard limit on concurrency per replica
    minReplicas: 0            # minimum available replicas (0 enables scaling to zero)
    maxReplicas: 10           # max available replicas
You can also influence scaling behaviour by adding knative-related annotations (advanced) to the InferenceService spec. See details here. Example spec:
spec:
  predictor:
    annotations:
      autoscaling.knative.dev/class: "kpa.autoscaling.knative.dev"
      autoscaling.knative.dev/metric: "concurrency"
      autoscaling.knative.dev/target-utilization-percentage: "70"
KEDA (Kubernetes Event-driven Autoscaling)⚓︎
For LLM inference workloads, Knative's request-based autoscaling is often not optimal. LLM requests vary significantly in duration depending on token count, and what matters is latency (Time To First Token) and GPU memory pressure (KV cache), not just request count.
KEDA enables autoscaling based on custom Prometheus metrics from vLLM, such as:
- Time To First Token (TTFT): Scale when P95 latency exceeds a threshold
- GPU KV-cache utilization: Scale when GPU memory pressure increases
- Running/waiting requests: Scale based on queue depth
Prerequisites⚓︎
KEDA must be installed in the cluster. Ask your administrator to install it if it is not available:
helm repo add kedacore https://kedacore.github.io/charts
helm install keda kedacore/keda --namespace keda --create-namespace
Example with vLLM⚓︎
- Deploy an InferenceService with vLLM backend:
apiVersion: serving.kserve.io/v1beta1
kind: InferenceService
metadata:
  name: opt-125m-vllm
spec:
  predictor:
    minReplicas: 1
    maxReplicas: 10
    model:
      modelFormat:
        name: huggingface
      args:
        - --model_name=opt-125m
        - --model_id=facebook/opt-125m
        - --backend=vllm
      resources:
        requests:
          cpu: "2"
          memory: 4Gi
        limits:
          cpu: "4"
          memory: 8Gi
- Create a KEDA ScaledObject to scale based on TTFT:
PodMonitor already configured
prokube already includes a PodMonitor for vLLM metrics, so you don't need to create one yourself.
The following ScaledObject scales up when 95% of requests take more than 200ms to receive the first token (TTFT). Adjust the threshold value based on your latency requirements.
apiVersion: keda.sh/v1alpha1
kind: ScaledObject
metadata:
  name: opt-125m-vllm-scaledobject
spec:
  scaleTargetRef:
    apiVersion: apps/v1
    kind: Deployment
    name: opt-125m-vllm-predictor-00001-deployment  # adjust to your deployment name
  pollingInterval: 15
  cooldownPeriod: 60
  minReplicaCount: 1
  maxReplicaCount: 10
  triggers:
    # Scale based on Time To First Token (TTFT) P95
    - type: prometheus
      metadata:
        serverAddress: http://kube-prometheus-stack-prometheus.monitoring.svc.cluster.local:9090/prometheus
        metricName: vllm_ttft_p95
        query: |
          histogram_quantile(0.95, sum(rate({"__name__"="vllm:time_to_first_token_seconds_bucket", namespace="<your-namespace>"}[2m])) by (le))
        threshold: "0.2"  # 200ms
        activationThreshold: "0.1"
    # Scale based on GPU KV-cache usage (for GPU deployments)
    - type: prometheus
      metadata:
        serverAddress: http://kube-prometheus-stack-prometheus.monitoring.svc.cluster.local:9090/prometheus
        metricName: vllm_gpu_cache_usage
        query: |
          avg({"__name__"="vllm:gpu_cache_usage_perc", namespace="<your-namespace>"})
        threshold: "0.7"  # 70%
        activationThreshold: "0.5"
vLLM metric names
vLLM uses colons in metric names (e.g., vllm:time_to_first_token_seconds). Use the {"__name__"="..."} syntax in PromQL queries.
Adjust namespace in queries
Replace <your-namespace> in the metric queries with the actual namespace where your InferenceService is deployed.
For a complete working example, see the kubeflow-examples repository.